Tavant FinConnect

Tavant FinConnect
Monitoring refers to the ability to observe performance metrics captured in real time while the application is running in production. The captured metrics are compared to baselines based on past performance, to determine whether current performance is normal or problematic. Setting up monitors provide FinConnect support team an early warning of the systems's health and help in troubleshooting.
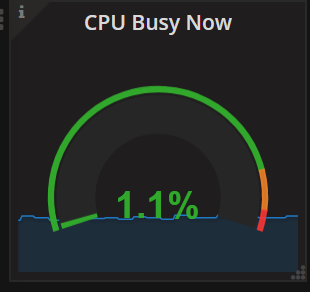
Server monitoring uses the Standalone Machine Agent to provide extended hardware metrics and service availability monitoring. Server monitoring includes additional windows in the UI that enables to see instantly underlying infrastructure issues impacting your application performance. This means you can rapidly troubleshoot hardware performance problems that are impacting your applications.
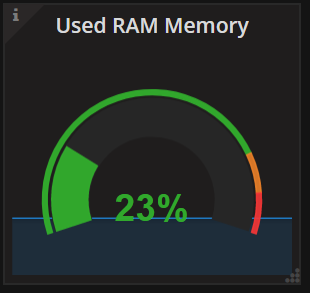
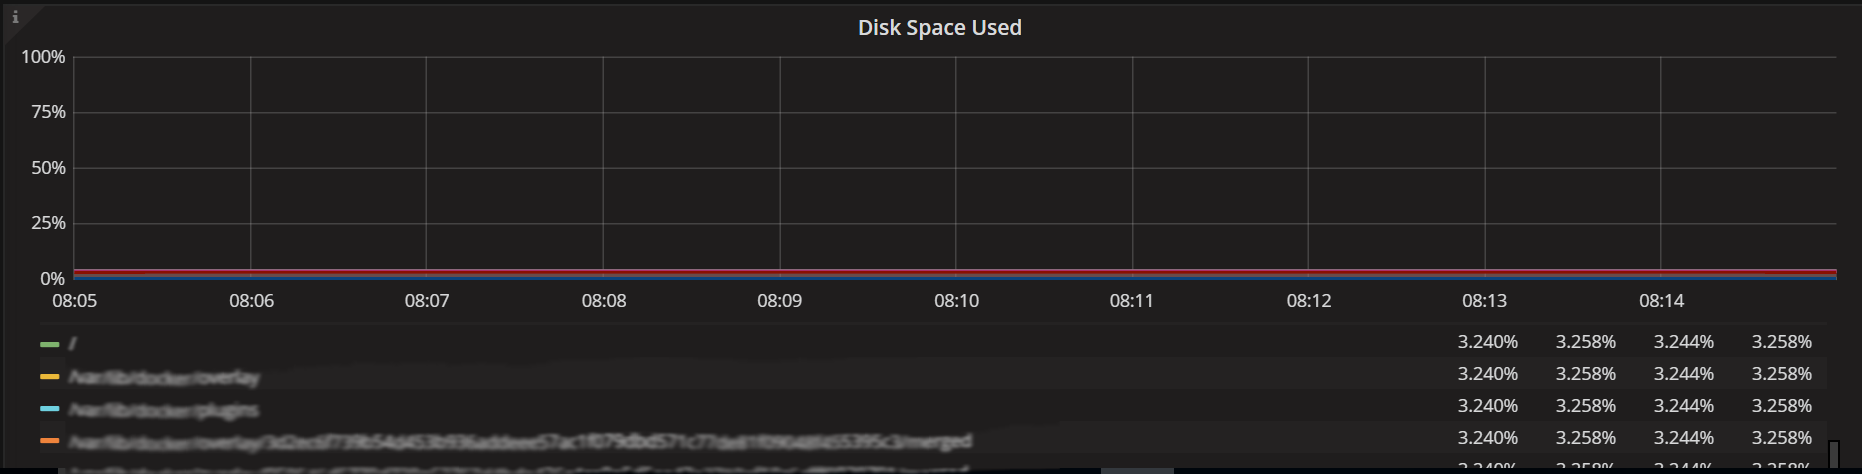
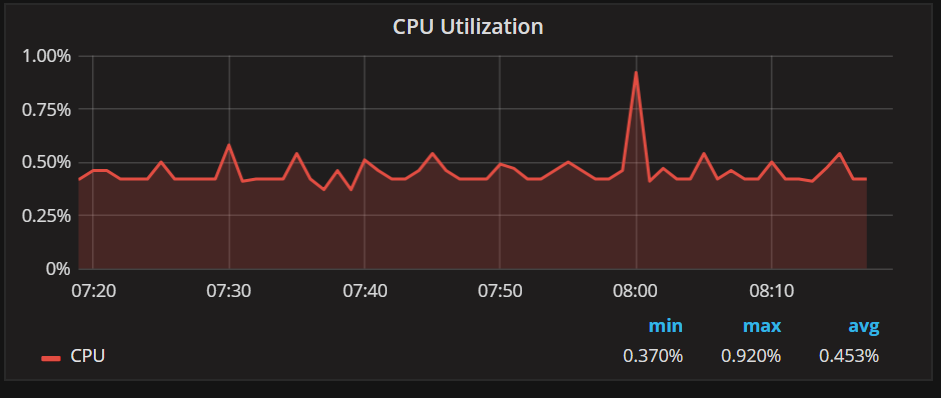
FinConnect monitors large number of metrics on servers. Below are few of the important metrics being monitored on servers.
|
Server Up or Down |
CPU Utilization |
|
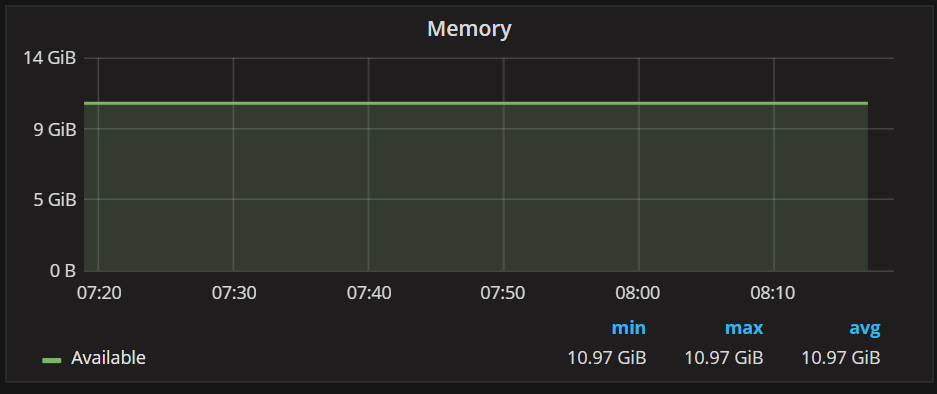
Memory Utilization |
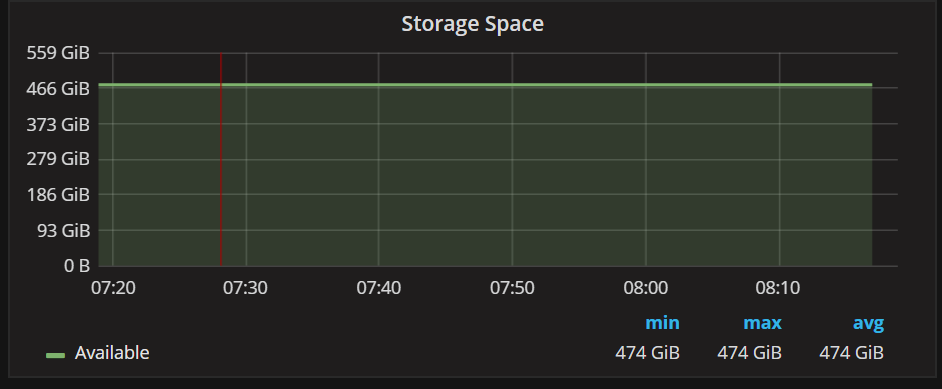
Available Disk Space |
FinConnect uses cloud watch to monitor and collect metrics, for database servers and elastic cache nodes for situations you need to be aware of, whether it be to load that is too high, disk capacity is too low, number of active connections.
|
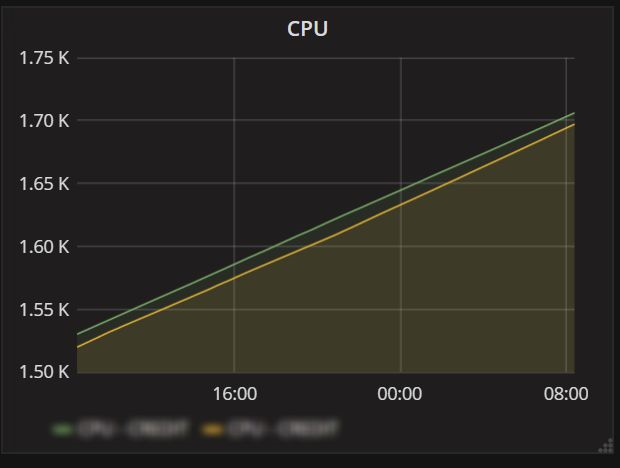
CPU |
Memory |
|
Disk Space Available |
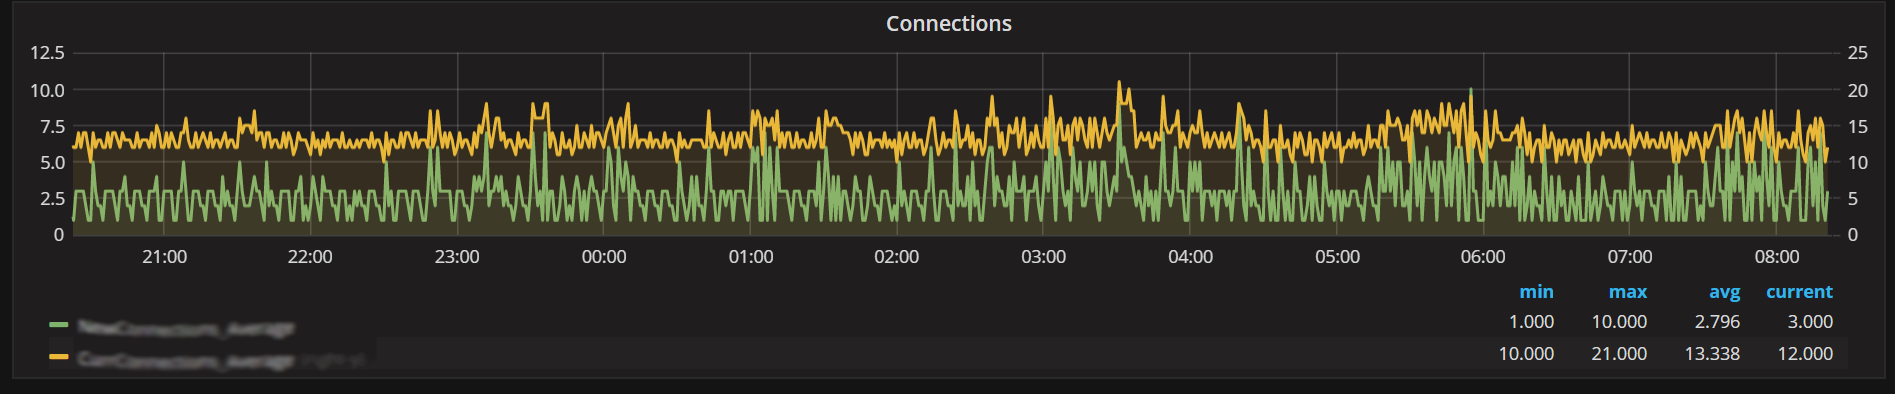
Number of Active Connections |
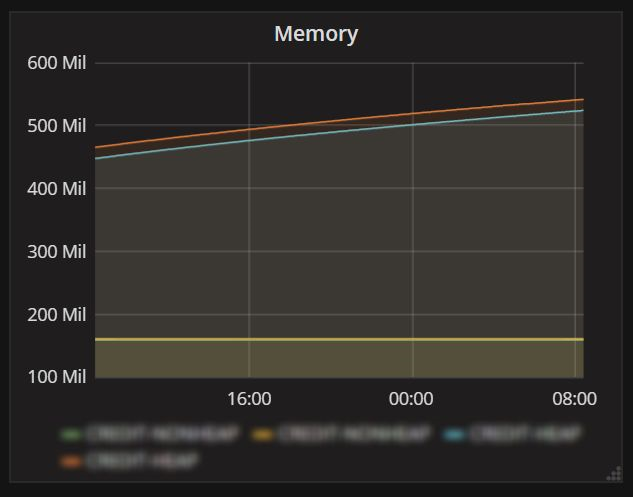
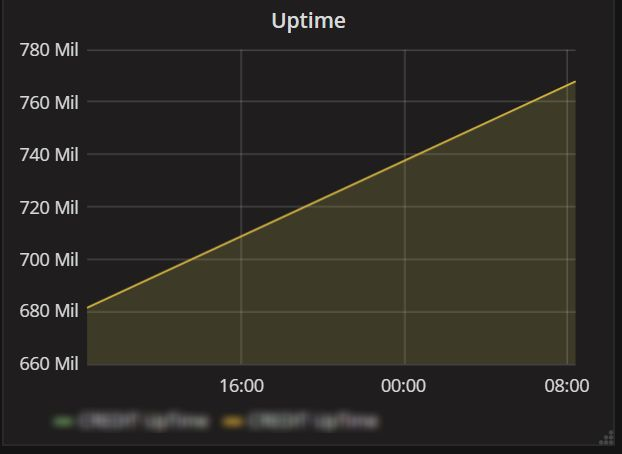
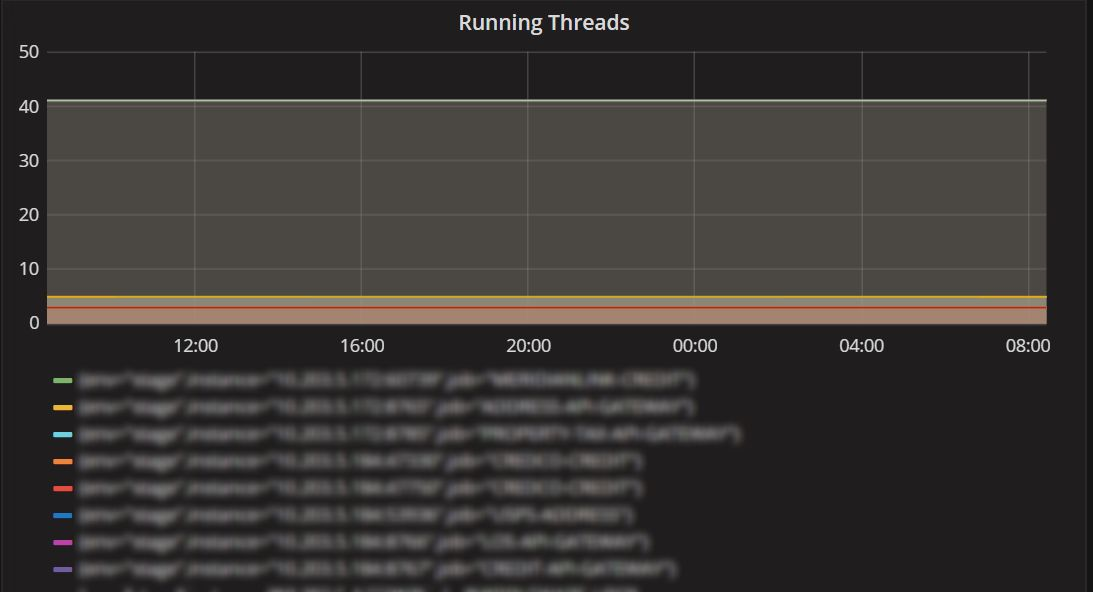
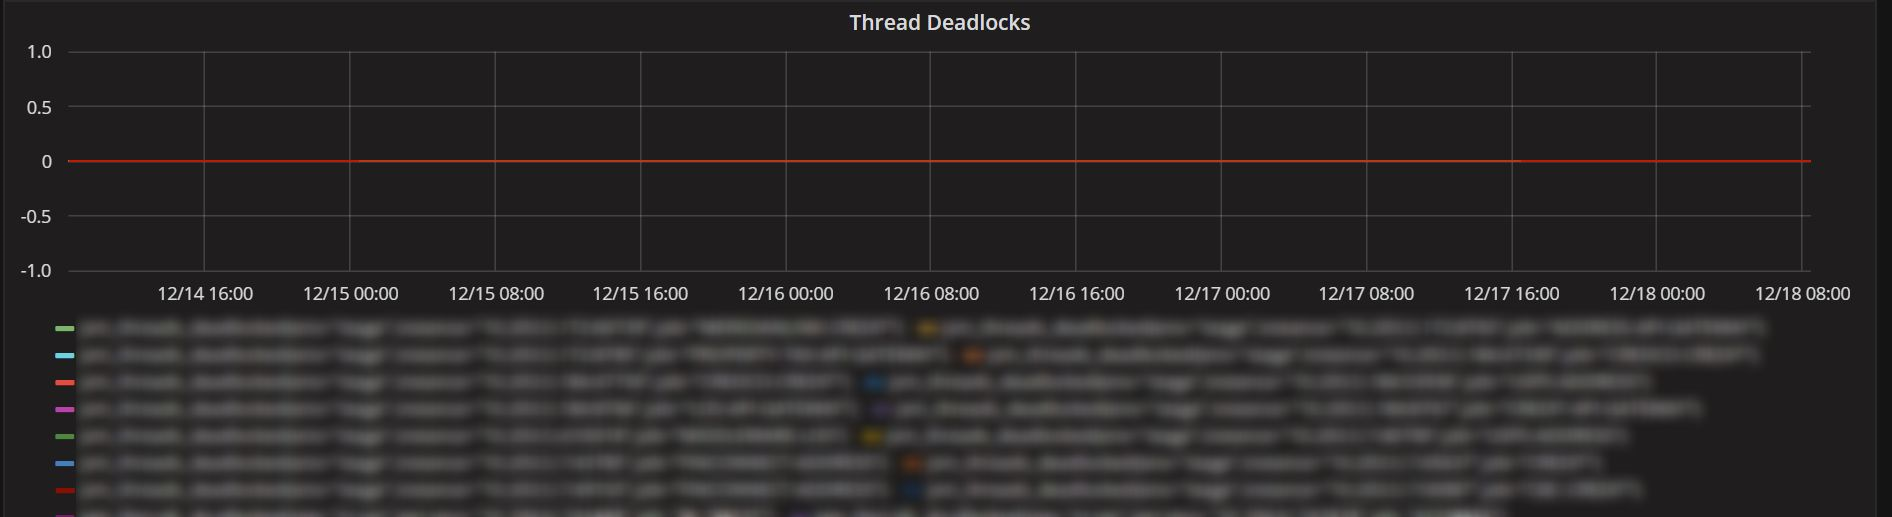
Application monitoring uses the endpoints for collecting the application metrics. These endpoints provide extended service metrics.
|
CPU Utilization |
Memory Utilizations |
|
Up Time |
|
|
Number of Running Threads |
Number of Thread Deadlocks |
|
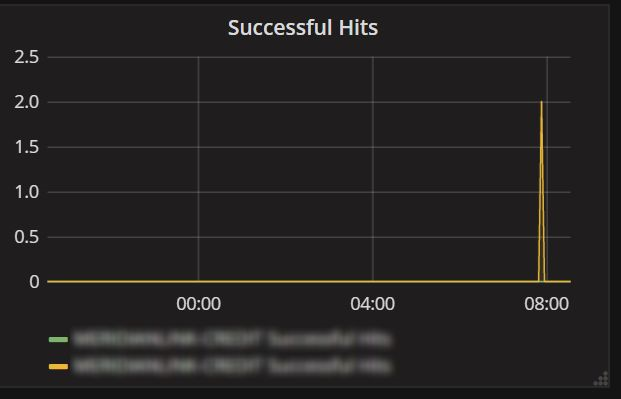
Total Number of Success Requests |
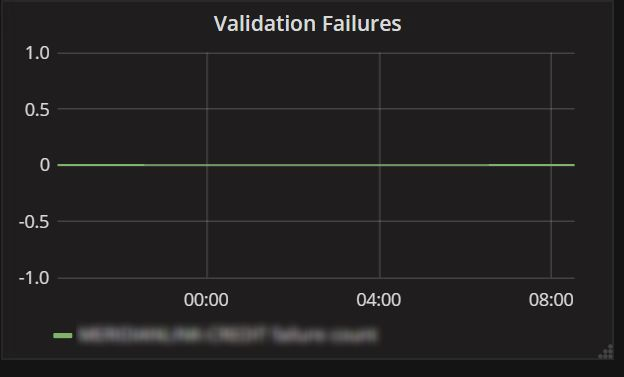
Total Number of Failure Requests |
|
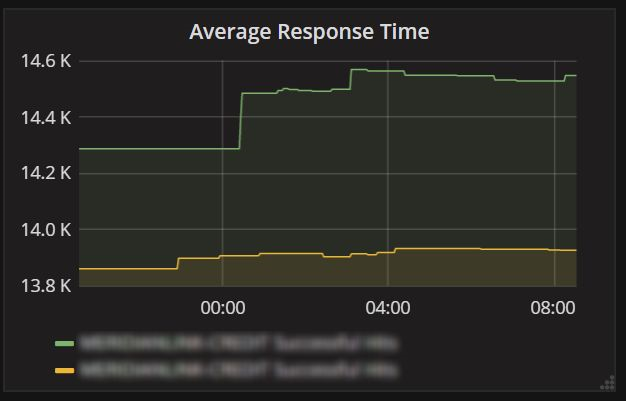
Average Time taken for Success Response |
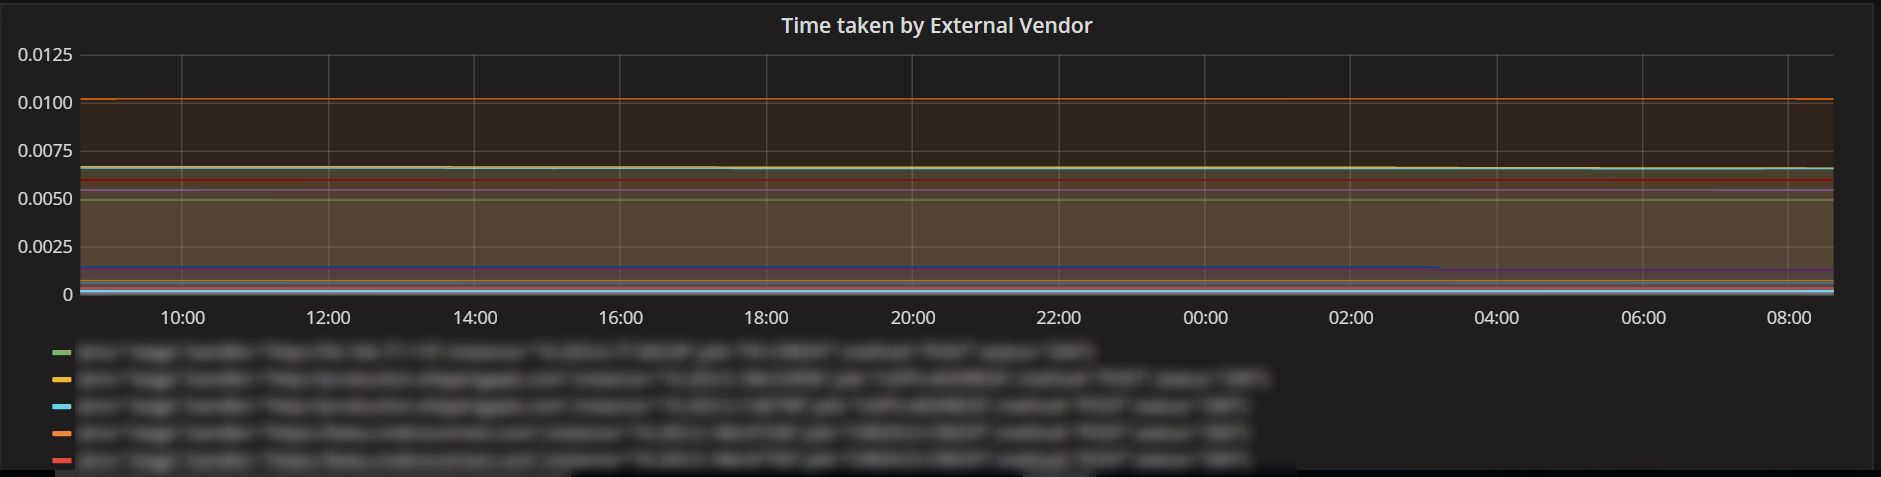
Time taken by External Vendor |
When key performance indicators spike or drop, FinConnect will send out notifications to individuals and/or teams in your organization. FinConnect provides coordinated alerting tools that allow you to focus on the metrics that you care about the most, so you can address the underlying problems before they reach your end users. FinConnect alerts group of support individuals with 2 types of alerts warning alerts and critical alerts.
Below is the list of parameters which FinConnect uses to detect any abnormal behavior and sends out alerts for troubleshooting.
|
Servers |
Critical |
Warning |
|
CPU |
>75% |
>50% |
|
Memory Used |
>80% |
>60% |
|
Disk Space Used |
>80% |
>60% |
|
Down |
0 |
1 |
|
Database |
||
|
CPU |
>75% |
>50% |
|
Memory |
>80% |
>60% |
|
Disk Space |
>80% |
>60% |
|
Number of Active Connections |
500 |
500 |
|
Down |
0 |
|
|
Elastic Cache |
||
|
CPU |
>75% |
>50% |
|
Memory |
>80% |
>60% |
|
Disk Space |
>80% |
>60% |
|
Number of Active Connections |
200 |
100 |
|
Down |
0 |
|
|
Application |
||
|
jvm_threads_currect |
>150 |
>100 |
|
jvm_memory_bytes_used |
>1GB |
>750MB |
|
external_http_response_time_milliseconds |
>60 seconds |
>45 seconds |
|
external_http_error_requests_total |
> 10 in last five minutes |
>5 in last five minutes |
|
external_zuul_error_requests_total |
>10 in last five minutes |
>5 in last five minutes |
|
external_zuul_response_time_milliseconds |
>60 seconds |
>45 seconds |
|
external_http4_error_requests_total |
>10 in last five minutes |
>5 in last five minutes |
|
jvm_threads_started_total |
>100 |
>75 |
|
jvm_threads_deadlocked |
>25 |
>15 |
|
http4_response_time_milliseconds_count |
>60 seconds |
>45 seconds |
|
up |
0 |
|
|
|
|
|
|
|